Grain Growth
The examples T10_11_GrainGrowthInitialFromFile_2D, T10_30_GrainGrowthPinning_2D and T10_40_GrainGrowthSoluteDrag_2D show how MICRESS® can be used without coupling to external fields like temperature or concentration, i.e. using only the curvature as a driving force for the transformation. Respective curvature based coarsening is inherent to phase-field models. These examples also show how to read-in initial microstructures.
The T10_11_GrainGrowthInitialFromFile_2D example displays pure grain growth, whereas the other examples draw on specific models hindering grain boundary motion like e.g. the particle pinning, the solute-drag and KTH-solute-drag models, respectively.
In addition, grain growth with non-linear temperature profiles is modeled in the T10_20_GrainGrowthTempProfiles_2D example.
The example T10_41_GrainGrowthDGDependentMobility_2D is the same as T10_40_GrainGrowthSoluteDrag_2D apart from the mobility which is not constant but dependent on the driving force.
Alloy
The alloy system and composition are not specified.
Simulation conditions
| Example | T10_11 | T10_20 | T10_30 | T10_40 | T10_41 |
|---|---|---|---|---|---|
| Dimension | 2-D | ||||
| Grid size | 400x320 cells | 100x500 cells | 400x320 cells | ||
| Grid spacing | 1.5 microns | ||||
| Interface thickness | 5 cells | ||||
| Boundary conditions | Phase field
| ||||
| Solid phases | one phase | ||||
Results
Pure grain growth
T10_01_GrainGrowth_2D grain growth sequence
| t = 0s | t = 500s | t = 1000s |
|---|---|---|
 |  |  |
Grain growth with particle pinning
T10_30_GrainGrowthPinning_2D grain growth sequence
| t = 0s | t = 500s | t = 1000s |
|---|---|---|
 |  |  |
Grain growth with solute drag
T10_40_GrainGrowthSoluteDrag_2D grain growth sequence
| t = 0s | t = 500s | t = 1000s |
|---|---|---|
 |  |  |
Grain growth with solute drag and driving force dependent mobility
T10_41_GrainGrowthDGDependentMobility_2D grain growth sequence
| t = 0s | t = 500s | t = 1000s |
|---|---|---|
 |  |  |
Grain growth with temperature dependent mobility
T10_20_GrainGrowthTempProfiles_2D grain growth sequence
| t = 0s | t = 0.32s | t = 1s |
|---|---|---|
 |  |  |
T10_20_GrainGrowthTempProfiles_2D temperature profile sequence
| t = 0s | t = 0.32s | t = 1s |
|---|---|---|
 |  |  |
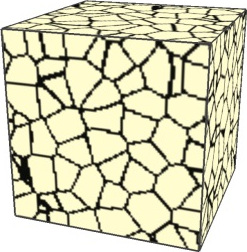
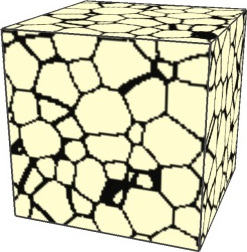
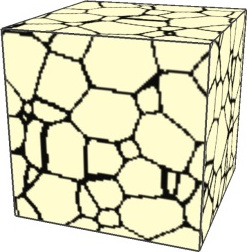
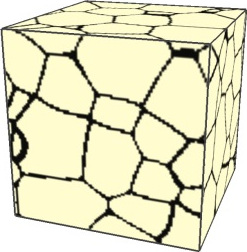
Grain growth with low-angle misorientation in 3D
This example demonstrates how to treat low-angle misorientation based on the models of Humphreys and Read-Shockley, as well as how to distinguish high-angle boundaries with special misorientation such as {\sum}\,3 and {\sum}\,9 boundaries using the misorientation model.
T10_04_GrainGrowthMisorientation_3D grain growth sequence showing low-angle boundaries (blue), {\sum}\,3 boundaries (red) and {\sum}\,9 boundaries (green)
| t = 0s | t = 250s | t = 500s | t = 1000s |
|---|---|---|---|
 |  |  |  |
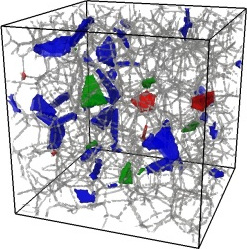 | 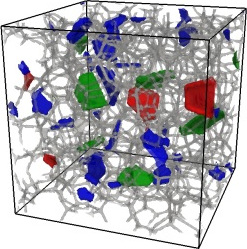 | 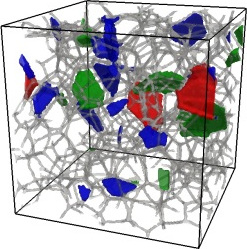 | 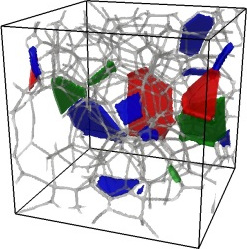 |