View
View
3D
DP_MICRESS is 2D viewer which displays slices in case of 3D simulation area. The parameter in the 3D section allow to choose a dedicated slice.
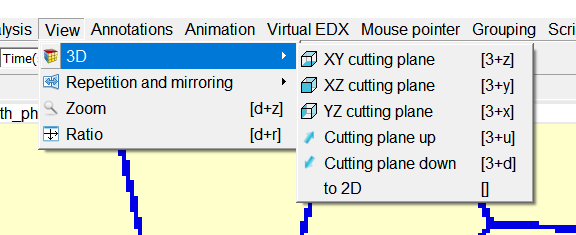
Cutting plane up and Cutting plane down shift the chosen 'Cutting plane' (XY, XZ or YZ) by one cell of the simulation area. 'Up' means in direction of higher coordinates.
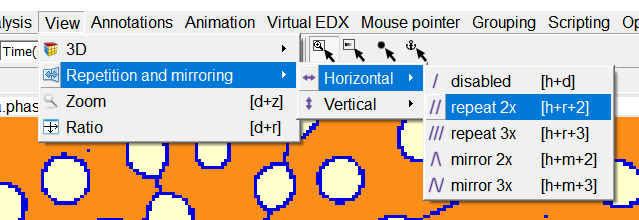
Repetition and mirroring
This tool refers on one chosen active dataset and duplicates the dataset in a specific manner. So firstly there has to be decided whether this tool is applied horizontally or vertically. For both, the same operations can be executed. Then, the dataset can be repeated by stringing the same files together, twice or three times. This is the Repetition function. The Mirroring tool works alike: The same dataset is mirrored in a series twice or three times. This form of expression can be revised by pressing the disabled button.
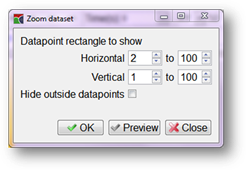
Zoom
Principally the Zoom tool serves the same purpose as the zooming by opening a rectangle. It just differs from the rectangle zooming in the manually setting. The unit of reference are cells. When zooming the rest of the dataset is normally cut. Here DP_MICRESS makes use of a special function: If there is still space for the cut area after zooming, this area is kept on showing until the hide outside datapoints field is activated.
There is a special case regarding the Virtual EDX: If a Virtual EDX line is marked, it is not restricted to the zoom, but can also be outside the zoom. This occurs when selecting Zoom in. Analogously, the default line scan becomes invalid when Repetition or Mirroring are selected.
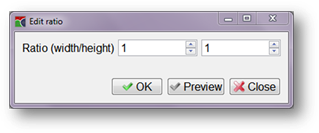
Ratio
This application gives the ratio of width to height. So it is possible to set this ratio in a different way by entering the data according to an adequate presentation. This function is especially useful for one-dimensional datasets or cell sizes, which are not programmed in a 1/1 ratio.
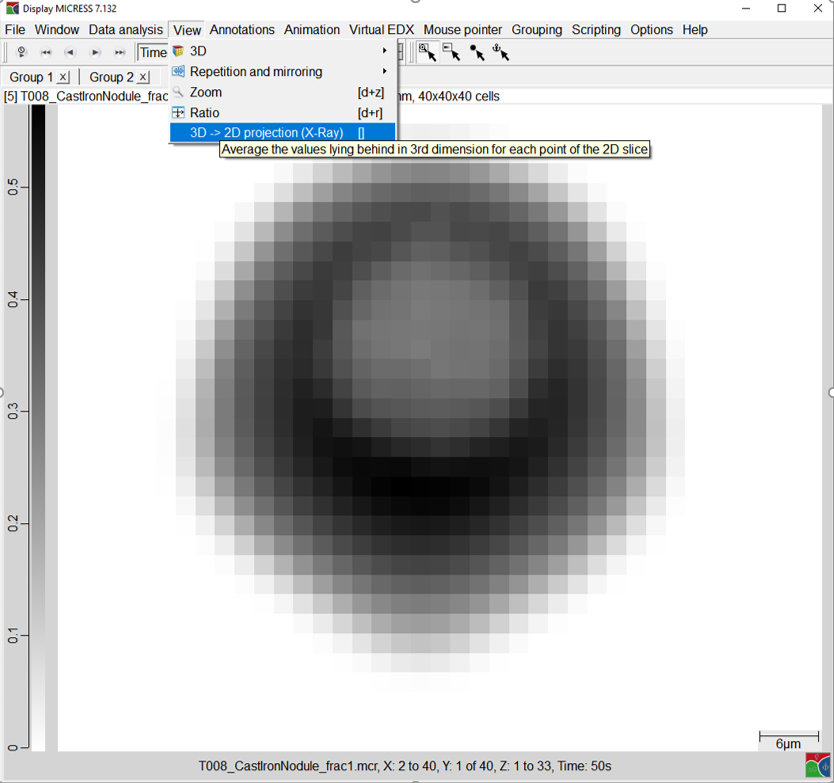
3D -> 2D projection (X-Ray)
This feature generates a 3D dataset in which each layer contains the averaged values of all layers lying behind. Applying a gray-value colour scale, it look a little bit like an X-ray image. See here the projection of the 3D fraction data set of example T008_CastIronNodule: